
Usage, Billing and Plans
See what the workspace consumes, what the next invoice will cost, and which plan fits before a quota runs out.
These images are illustrations of the concept, not screenshots of the actual product.
Overview
Automation spending behaves differently from most software: cost tracks how much the workspace runs as well as how many people it seats. This concept illustrates how FluidGrids is designed to make that relationship legible, with one place where the current plan, the meters that drive it, the next invoice and the upgrade decision sit together, so nobody has to reconstruct cost from run history.
The problem it addresses is the quiet quota. A workflow is scheduled once and keeps firing, a new webhook doubles the volume overnight, and the first sign that an allowance ran out is an automation that stopped. Teams also over-buy when plan differences are written as marketing copy rather than set against what they actually consume. The design keeps a usage reading in the persistent side navigation, so consumption for the current cycle stays on screen wherever someone is working.
Across the two screens the experience moves from measurement to decision. The Billing tab of workspace settings shows the current plan and renewal date beside a usage panel that meters workflow runs against the monthly allowance, alongside active workflows, connectors and team seats. Next to it, an upcoming-invoice summary splits the plan charge from any overage and states the total due, above the stored payment method, with a paginated history of past invoices below, each row carrying a status badge and a download action. When the meters suggest a change, the Plans view lays out Free, Starter, Pro and Enterprise side by side with a monthly or annual toggle and a shared feature list: workflow and execution limits, concurrency, custom nodes, AI authoring, analytics depth, API access, single sign-on, audit-log retention, service-level targets and seats. The current tier is marked in place, and each card ends in the action that fits its position.
The concept sits in the administration area next to workspace settings, roles and the audit trail, and is designed to draw on the same execution counts that analytics and run history present operationally. All figures, prices, dates and plan contents in the illustrations are invented sample data used to show the layout.
What this concept shows
- A current-plan card with the tier, a sample monthly price, the renewal date and a change-plan button
- A usage panel metering workflow runs against the monthly allowance, plus active workflows, connectors and team seats, each with a progress bar
- A usage reading in the side navigation showing percentage consumed, runs or executions against the allowance, and when the cycle renews or resets
- An upcoming-invoice summary that separates the plan charge from overage and states the total due with its currency
- A payment method card with card brand, masked number, expiry, a primary badge and an edit control
- A paginated invoice history sorted by date, with description, amount, a paid status badge and a document download per row
- A four-tier plan comparison with a monthly or annual billing toggle that carries an annual saving badge
- A shared feature list on every tier card, with per-tier actions to downgrade, upgrade, see the current plan or contact sales
How it works
- Notice the usage reading in the side navigation and open the Billing tab in workspace settings.
- Read the current plan, its renewal date and the meters for runs, workflows, connectors and seats.
- Check the upcoming invoice to see the plan charge, any overage and the total due, and confirm the payment method on file.
- Download an earlier invoice from the history table if finance needs the record.
- Open the Plans view to compare tiers, switch between monthly and annual billing, and read the feature grid against current consumption.
- Choose the action on the tier that fits — upgrade for more headroom, downgrade to trim, or contact sales for a custom arrangement.
Who it's for
- Workspace owners responsible for the automation budget
- Operations and automation leads watching run consumption against quota
- Finance and procurement staff who need invoices and renewal dates
- Platform administrators planning capacity before quotas bind
- Team leads deciding how many seats and workflows to provision
Illustrations
2 illustrations of this concept. Select one to view it full size.
Billing and Usage in Workspace Settings
A desktop layout for the Billing tab of workspace settings, reached from a tab row that also lists general, team, security, notifications, API keys, webhooks and advanced sections. The upper band holds three areas: a current-plan card with the tier name, a sample monthly price, a renewal date and a change-plan button; a usage overview metering workflow runs against a monthly allowance with a percentage, then active workflows, connectors and team seats, each with its own progress bar; and, at the right, an upcoming-invoice summary splitting the plan charge from overage to a total due, above a stored card showing masked digits, expiry and a primary badge. Below, an invoice table sorted by date lists description, amount, a paid status badge and a document download per row, with pagination beneath. The side navigation carries a running usage reading and renewal date for the cycle. All figures are invented sample data.
Plan Comparison and Upgrade
A Plans page reached through a breadcrumb from settings, shown on desktop. A heading invites the reader to choose a plan, and a segmented toggle at the right switches between monthly and annual billing, the annual option carrying a saving badge. Four cards sit side by side: Free for individuals getting started, Starter for small teams, Pro for growing teams, highlighted with a combined current and popular badge, and Enterprise priced as custom for larger organizations. Each card repeats the same list so the columns read across: workflows, monthly executions, concurrency, custom nodes, AI Studio access, analytics depth, API access, single sign-on, audit-log retention, a service-level figure and team seats, each marked with a check or a dash. The cards end in different actions: downgrade, upgrade, the marked current plan and contact sales. A footer note frames pricing as usage-based, and the side navigation shows executions used this month with a reset countdown and a link to usage. Prices and limits are invented sample data.
Topics
- workflow automation usage metering
- execution quota tracking
- automation billing dashboard
- upcoming invoice and payment method
- invoice history download
- plan comparison and upgrade
- monthly versus annual billing
- team seat limits
- concurrency limits by plan
- usage-based automation pricing
- workspace subscription settings
- run allowance overage
Related concepts
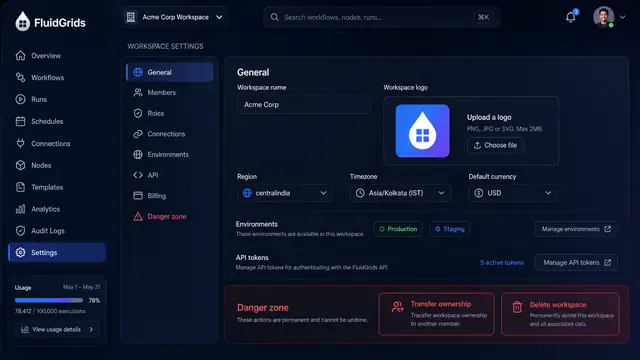
Workspace Settings, Roles and Audit Trail
Configure a workspace, decide who can do what with a role matrix, and trace every change in a filterable audit log with diffs.
3 illustrations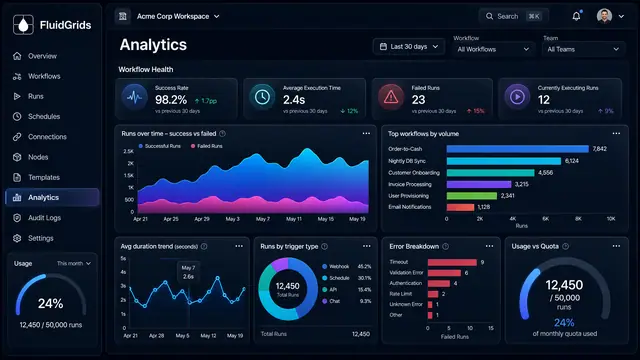
Analytics and Operational Health
Measure success rates, durations, error types and live worker health across every workflow in one place.
3 illustrations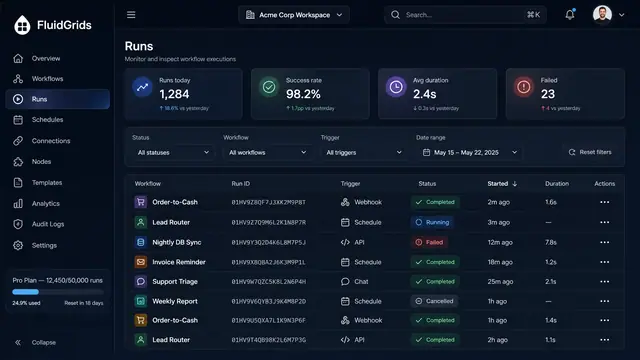
Run History, Inspection and Recovery
Follow every workflow execution node by node, then retry, resume or approve runs from a desktop or a phone.
5 illustrations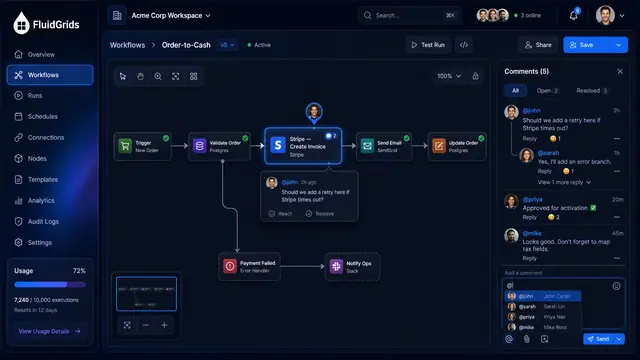
Comments and Notifications
Discuss a workflow on the node it concerns, mention teammates, and follow runs, quota and mentions from one notifications center.
2 illustrations