
Datasinks and Live Dashboards
End a workflow with a datasink node and its output flows into a live dashboard that refreshes on a schedule.
These images are illustrations of the concept, not screenshots of the actual product.
Overview
Datasinks turn a FluidGrids workflow into the data pipeline behind a dashboard. Instead of exporting spreadsheets or maintaining a separate ETL job, the last step of a workflow pushes its result to a named datasink in BigConsole, and any dashboard that reads from that key refreshes as new output arrives.
The concept addresses a familiar gap. Operational numbers tend to live in databases and SaaS tools that were never meant to be charted together, so teams fall back on nightly exports, brittle scripts or a queue of requests to a data team. Here, extraction, filtering, aggregation and delivery sit in one visual workflow that the people who own the numbers can read and change themselves.
The first illustration shows the cause. A four-step pipeline on the builder canvas pulls orders from Postgres, keeps only paid orders, aggregates daily revenue and ends in a selected BigConsole DataSink node. Its Node Details panel lists the datasink operations (post, upsert, append and delete), a copyable datasink key, a refresh schedule and a note that the node needs no manual input because it collects the previous node's output automatically, with a JSON preview of that payload. The second illustration shows the effect: a live revenue dashboard that names its source key, says when it last updated and traces the source workflow from schedule to datasink, above KPI cards, a thirty-day trend, channel and hourly breakdowns, a top-products table and a regional split.
Datasinks complement the built-in workflow analytics. Those measure how healthy the automations are; this concept puts a workflow's business output on screen. Because the pipeline is an ordinary workflow, the design lets it inherit everything else FluidGrids provides, including schedules, versioning, run history and retries, so a broken dashboard can be traced back to a specific run and step.
What this concept shows
- A BigConsole DataSink node that closes out any workflow on the canvas
- Four datasink operations: post, upsert, append and delete data
- A keyed destination, so each dashboard reads from a named datasink
- Automatic collection of the previous node's output, with a JSON payload preview
- A refresh schedule on the node, shown in the design as every five minutes
- A dashboard header that shows the source key, last update time and the lineage of the feeding workflow
- KPI cards, a time-series chart, channel bars, an hourly heatmap, a product table and a regional breakdown in one view
How it works
- Build or open a workflow that extracts and shapes the data; in the illustration, a Postgres query, a paid-orders filter and a daily revenue aggregate.
- Add the BigConsole DataSink node as the final step and choose an operation such as post, upsert, append or delete.
- Enter the datasink key that names the destination and set how often it refreshes.
- Check the auto-collected payload preview to confirm the previous node's output is what the dashboard should receive.
- Save and deploy the workflow so it runs on its schedule.
- Open the live dashboard, which shows the source key, last update time and workflow lineage above the charts.
Who it's for
- Data and analytics teams
- Revenue and business operations leads
- Finance and business analysts
- Automation builders who own reporting pipelines
Illustrations
2 illustrations of this concept. Select one to view it full size.
Configuring a Datasink Node on the Canvas
The illustration shows the FluidGrids builder with a sample Daily Revenue Pipeline workflow open and marked Active, with undo, redo, Save and Deploy controls in its header. On the canvas, four connected nodes each carry a success check: a Postgres node that extracts orders, a Filter node for paid orders only, an Aggregate node that computes daily revenue, and a highlighted BigConsole DataSink node. The Node Details panel on the right shows a connected status for the destination, an Operation dropdown open on post, upsert, append and delete options, a copyable DataSink key field, a refresh schedule chip and a Time to Live setting. An information note explains that no manual input is needed because the node collects the previous node's output automatically, and a JSON preview shows the sample payload with date, revenue, order count, currency, source and timestamp fields. Canvas tools, a minimap and zoom controls frame the graph.
Live Dashboard Fed by a Workflow
This illustration shows the other end of the datasink: a Revenue Ops live dashboard inside FluidGrids, with Analytics selected in the sidebar. The header states when the data last updated and names the source datasink key, while a Source Workflow strip traces the pipeline from Schedule to Postgres to Transform to DataSink, with a note that it updates every five minutes. Four KPI cards show revenue, orders, average order value and refund rate, each compared with the previous day. Below sit a thirty-day revenue area chart with a daily selector, a bar chart of orders by channel and a heatmap of orders by hour across the week. A Top products table lists orders, revenue, share of revenue and a thirty-day trend sparkline, next to a revenue-by-region donut and table. A closing banner makes the point that a workflow paints the dashboard without a separate ETL effort. All figures are sample data.
Topics
- workflow to dashboard
- datasink node
- live dashboard from a workflow
- no-code ETL pipeline
- stream workflow output to a dashboard
- BigConsole datasink
- scheduled data pipeline
- revenue dashboard automation
- visual ETL workflow
- upsert data into a dashboard
Related concepts
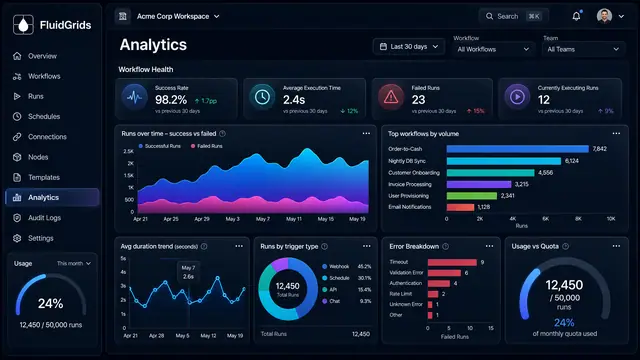
Analytics and Operational Health
Measure success rates, durations, error types and live worker health across every workflow in one place.
3 illustrations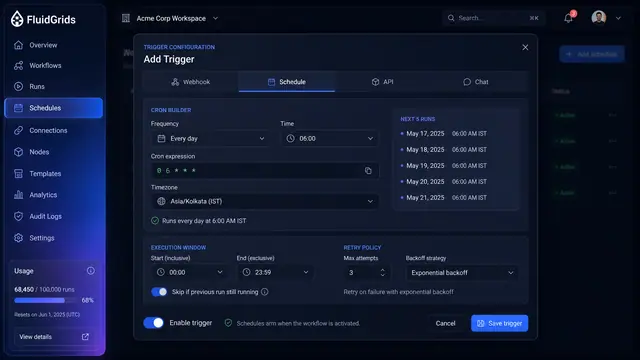
Triggers, Schedules and Webhooks
Decide what starts a workflow — a cron schedule, an incoming request, an API call or a chat message — and keep every trigger under control.
3 illustrations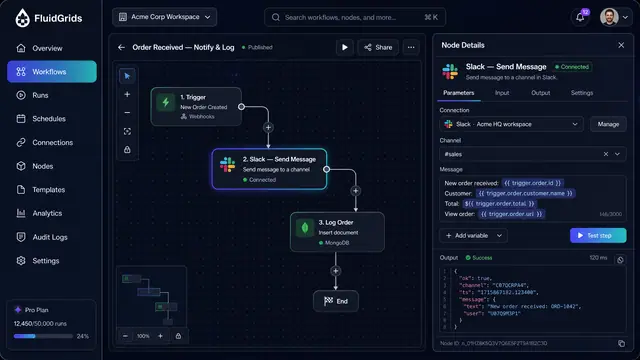
Node Configuration, Data Mapping and Code
Configure a step against a saved connection, map fields between services by dragging lines, and drop into sandboxed code when needed.
3 illustrations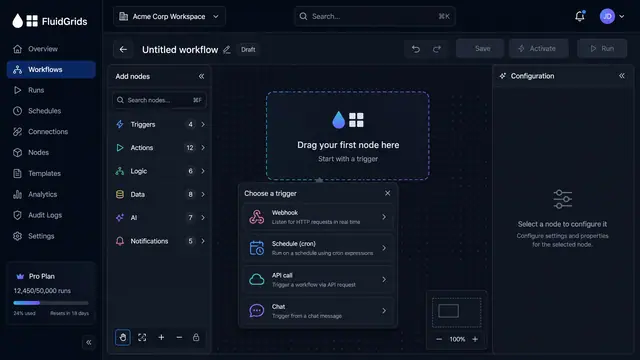
Visual Workflow Builder
Draw an automation on a canvas - trigger, branches, connectors and merges - then watch a test run light the same picture up step by step.
4 illustrations