
Customer-Tenant Automation Fleet View
Watch every automation your customers build in your embedded builder, tenant by tenant, and roll connector updates out in stages.
These images are illustrations of the concept, not screenshots of the actual product.
Overview
This concept is for software companies that embed the FluidGrids builder in their own product. Once customers can build automations inside a SaaS app, the vendor's integrations team inherits a fleet: many tenants, each with its own workflows, connections and connector versions. The illustrated Embedded automations view is designed to show that whole fleet on one page, tenant by tenant.
The problem for software and SaaS teams is that embedded automation fails inside someone else's account. A customer's accounting sync breaks when a token expires or an upstream service starts rate limiting, and the vendor often hears about it from a support ticket. Updating a shared connector carries its own risk: shipping a new version to every tenant at once can break many customers' automations in one move.
The illustration opens on tiles for tenants with automations, active workflows, failed runs and connector updates pending, the first three compared with the previous 24 hours. A Tenants table lists sample customers with their plan, number of workflows, top connector, success rate, failures in the last day, connector version and a status of healthy, attention or upgrade due, and a tenant's details are designed to open its failing runs. A Recent errors panel groups failures by type, such as an authentication error from an expired token, a rate limit and a timeout, and names the tenant affected. On the right, a Connector rollout panel stages a new connector version from internal tenants, marked done, to ten percent of tenants, in progress, and then to all tenants on a scheduled date, with a Pause rollout button for when errors climb.
A Where this data goes panel points to two hand-offs to other Burdenoff products. Each tenant's run data is designed to flow through a datasink into a BigConsole console of customer automation activity that the vendor can embed back in its own product as a customer-facing report. A linked PlanMagnet feature request is designed to record demand for a native accounting sync and how many accounts are behind it, so the team can see which integrations many tenants rely on before building anything natively. In this design, FluidGrids runs and measures the automations, BigConsole reports them to customers and PlanMagnet ties them to the roadmap.
What this concept shows
- Tiles for tenants with automations, active workflows, failed runs and pending connector updates, each with a small trend line
- A tenants table with plan, workflow count, top connector, success rate, 24-hour failures and connector version
- Per-tenant status badges for healthy, attention and upgrade due
- Recent errors grouped by type, including authentication, rate limit and timeout, with the tenant affected
- A staged connector rollout from internal tenants to ten percent of tenants and then to all, on a scheduled date
- A Pause rollout control for stopping an update when errors climb
- A datasink designed to feed a BigConsole customer activity console embedded in the host product
- A linked PlanMagnet feature request for a native accounting sync, with the number of accounts behind it
How it works
- Open Embedded automations for customer tenants and choose the time window.
- Read the fleet tiles and scan the tenants table for low success rates, recent failures or an attention badge.
- Check Recent errors to see which failure types are hitting which tenants, then open a tenant's details.
- Stage a connector update to internal tenants first, then to a small share of customers, and watch the error counts.
- Pause the rollout if failures climb, or let it reach all tenants on its scheduled date.
- Follow where the data goes: the BigConsole activity report for customers and the PlanMagnet request for a native integration.
Who it's for
- Integration and platform engineers at SaaS companies
- SaaS product managers
- Customer support and success leads
- Engineering leaders who own embedded automation
Illustrations
1 illustration of this concept. Select one to view it full size.
Embedded Automations Across Customer Tenants
The illustration shows an Embedded automations page tagged for customer tenants, with a last-24-hours filter and a refresh button. Four tiles with sparklines count tenants with automations, active workflows, failed runs and connector updates pending. The Tenants table lists sample home-service businesses, such as plumbing, electrical, roofing and HVAC companies, each with its plan, workflow count, top connector, success rate, failures in 24 hours, connector version and a status badge; one accounting sync tenant is highlighted for attention and another is marked upgrade due. Recent errors lists authentication, rate limit and timeout failures with counts, the tenant and how long ago each occurred. The Connector rollout panel steps an accounting sync update from internal tenants, done, to ten percent of tenants, in progress, to all tenants on a scheduled date, above a Pause rollout button. Where this data goes links a datasink to a BigConsole customer activity console embedded in the host app, and a PlanMagnet request to a native accounting sync.
Topics
- embedded automation monitoring
- multi-tenant workflow monitoring
- SaaS integration fleet management
- connector version rollout
- staged connector update
- customer tenant automation health
- embedded iPaaS monitoring
- tenant workflow failure tracking
- customer-facing automation activity report
- integration demand tracking
Related concepts
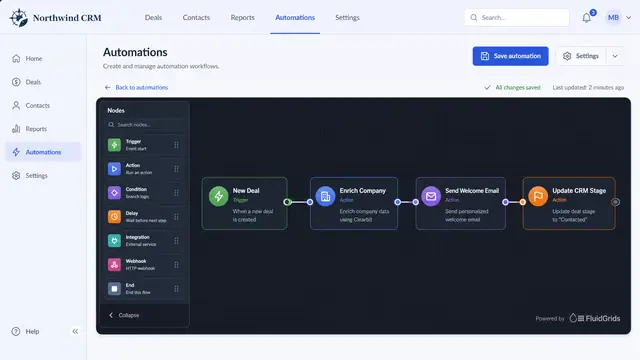
Embedded White-Label Builder
Put the FluidGrids builder, or a live read-only view of a workflow, inside your own product under your own brand.
2 illustrations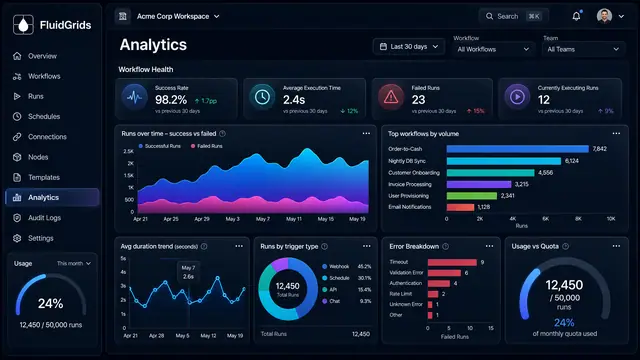
Analytics and Operational Health
Measure success rates, durations, error types and live worker health across every workflow in one place.
3 illustrations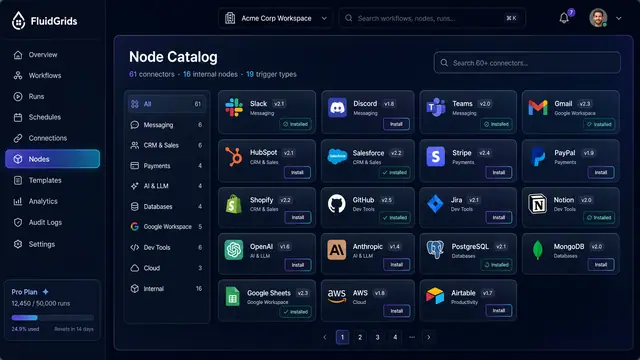
Node Catalog, Store and Custom Nodes
Browse versioned connectors, install packages and templates from a store, and publish your own nodes through a checked pipeline.
3 illustrations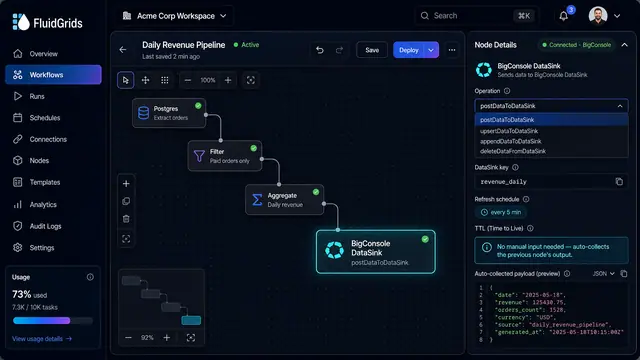
Datasinks and Live Dashboards
End a workflow with a datasink node and its output flows into a live dashboard that refreshes on a schedule.
2 illustrations
Part of an industry solution
This concept appears in a cross-product solution on burdenoff.com — see how it works alongside other Burdenoff products to solve a problem in that industry.